



Built and hosted in the EU
Web analytics that shows you how to win more customers.
TrustAnalytics shows where your visitors come from, what they do and where you lose them, so you know which page, step or campaign to improve next: with goals and funnels, heatmaps, session replay, Web Vitals and errors in one place.

- No cookies by default
- DPA included
- ISO 27001 infrastructure
Illustration of the TrustAnalytics dashboard for www.acme.eu: 48,210 visitors and 131,904 page views in the last 30 days, a bounce rate of 41.8%, a chart of visitors per day with a campaign peak, the pages visitors are on right now and the top sources.
How it works
From the first page view to the reason behind it.
Numbers tell you that visitors leave. The sessions, heatmaps and recordings behind the numbers tell you why, and they are one click away from every report.
Add one script tag. Paste it into your site. Page views are measured from the first visit.
See who visits. Sources, pages, countries and devices, live and over time.
Understand what they do. Goals, funnels, heatmaps and replays show where visitors leave.
Fix what holds them back. Slow pages, errors and broken forms point to the sessions behind them.
Illustration of one session from Munich on an iPhone that came from Google: a page view of the home page at 09:41, a product page, an add to cart event, a started checkout form and a purchase of 189 euros at 09:46, which reached the goal Purchase.
A look inside
Every answer in one place.
Traffic, conversions, behaviour, revenue and speed sit next to each other, so nobody pieces the picture together from five tools.
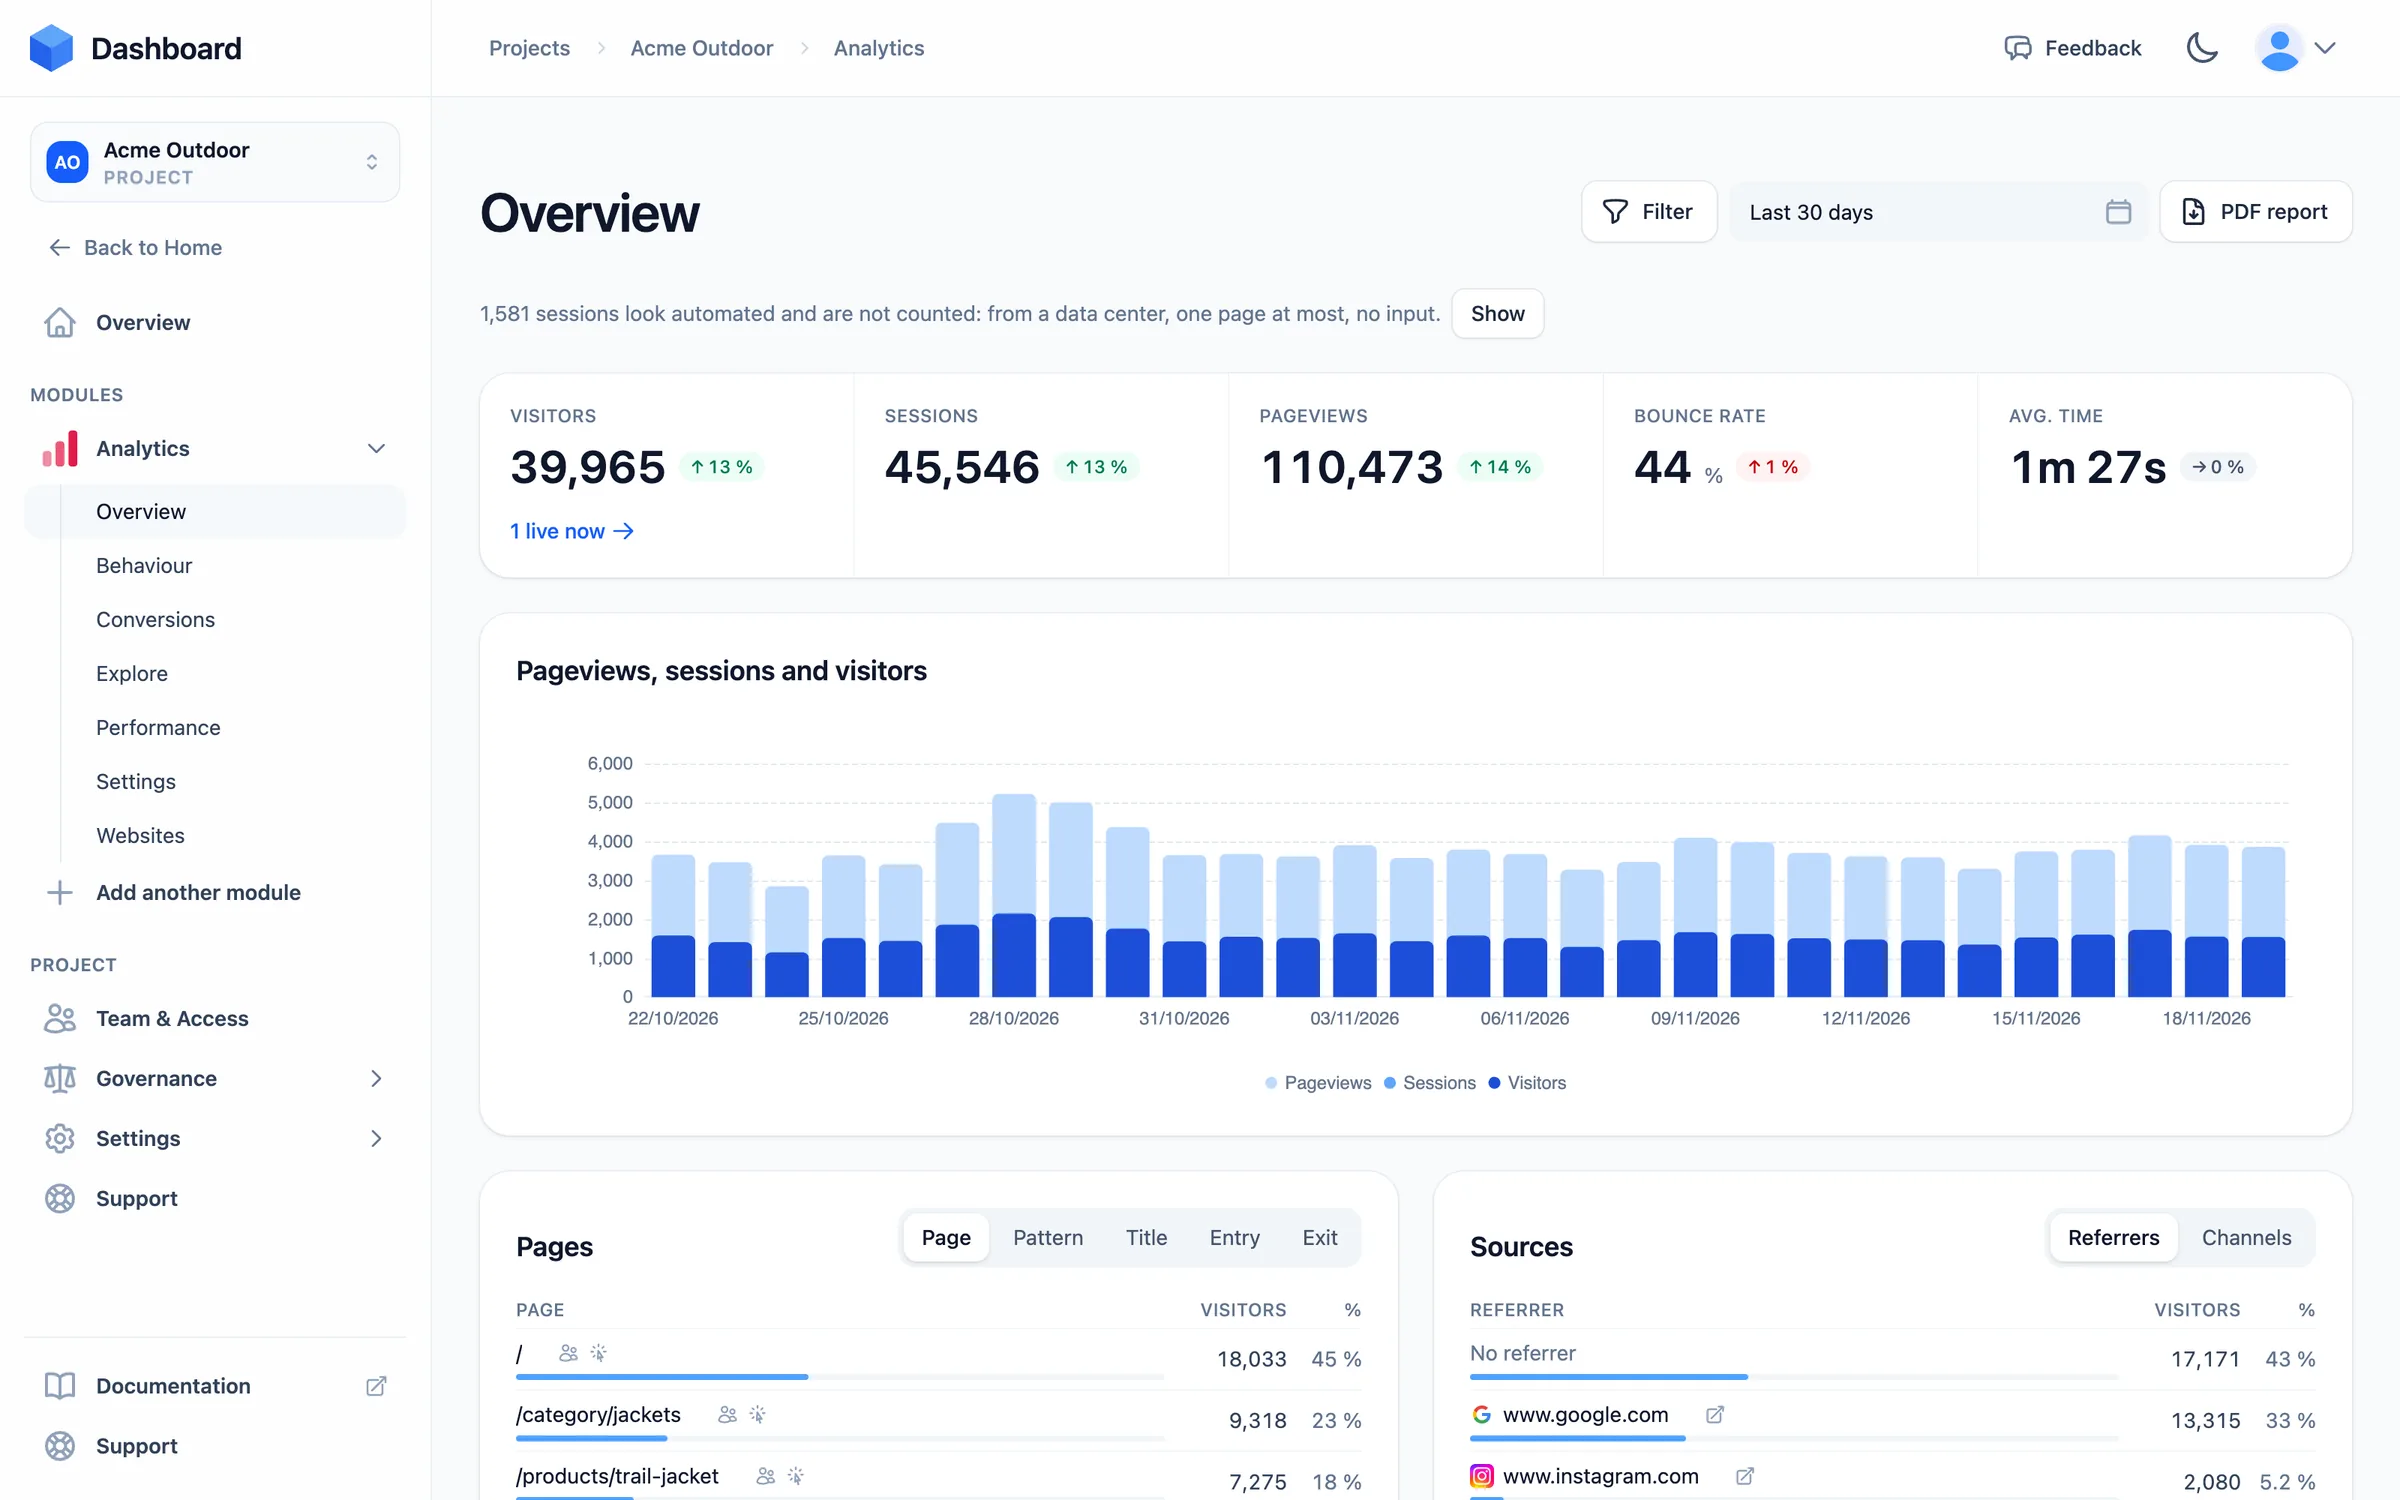
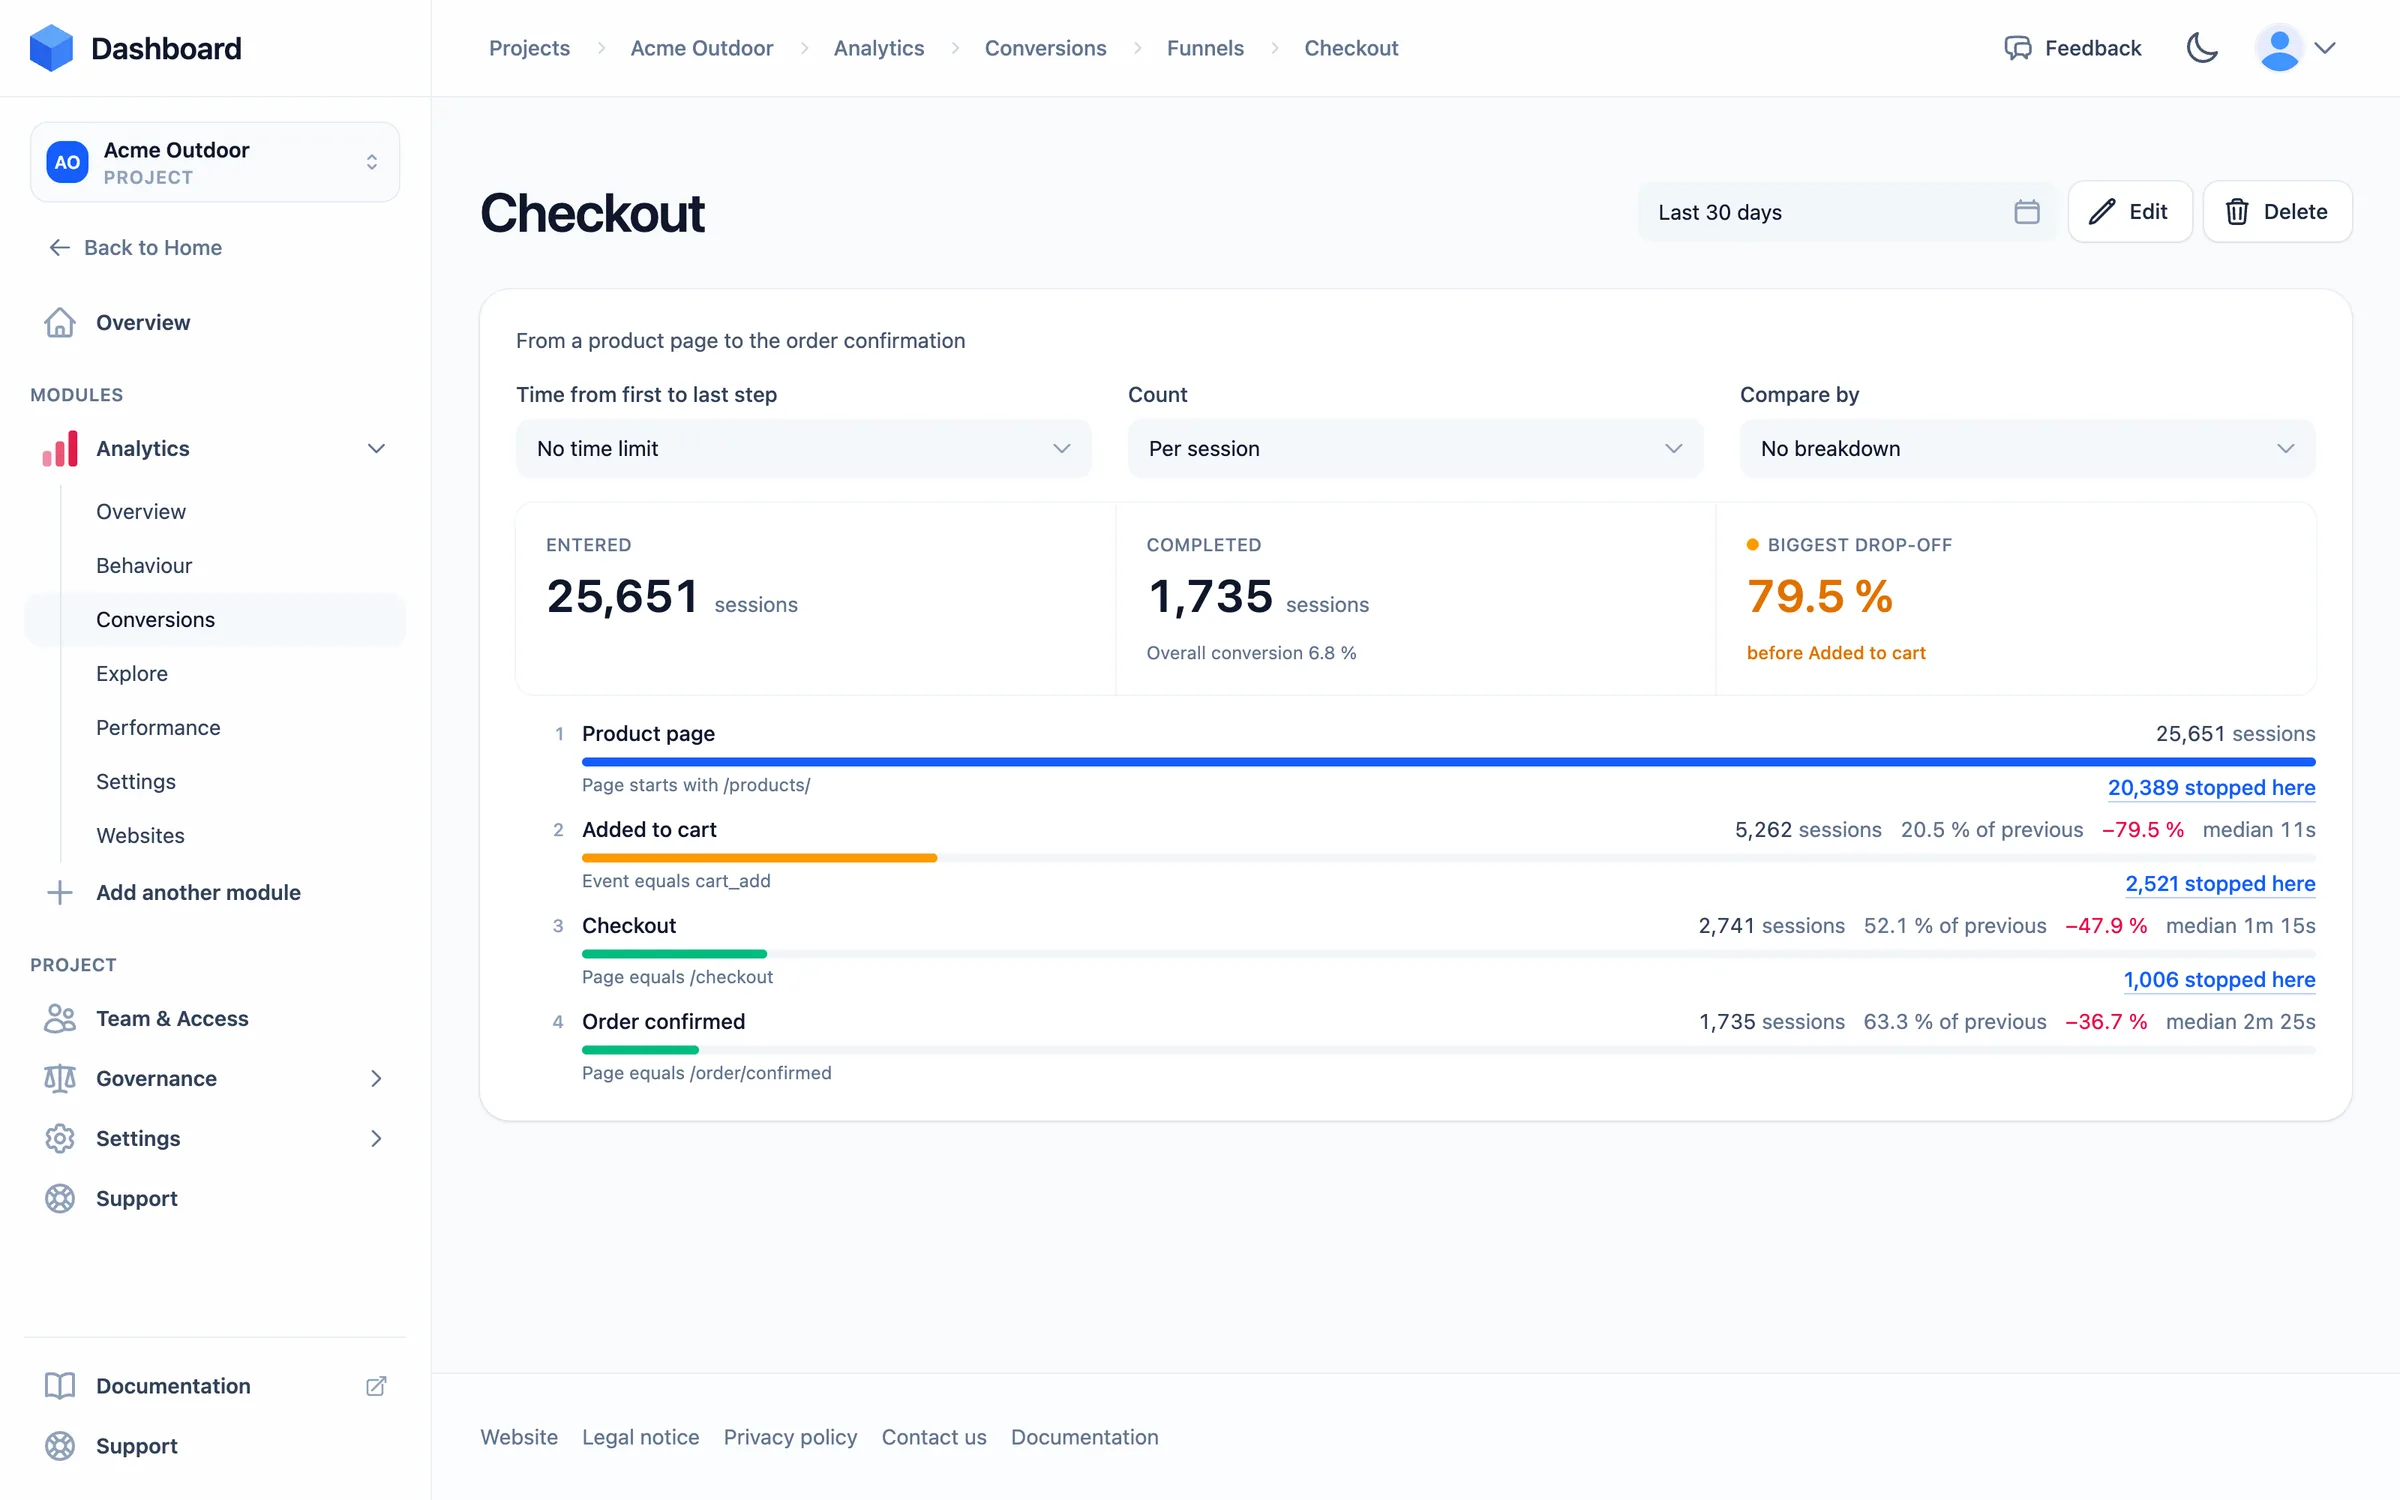
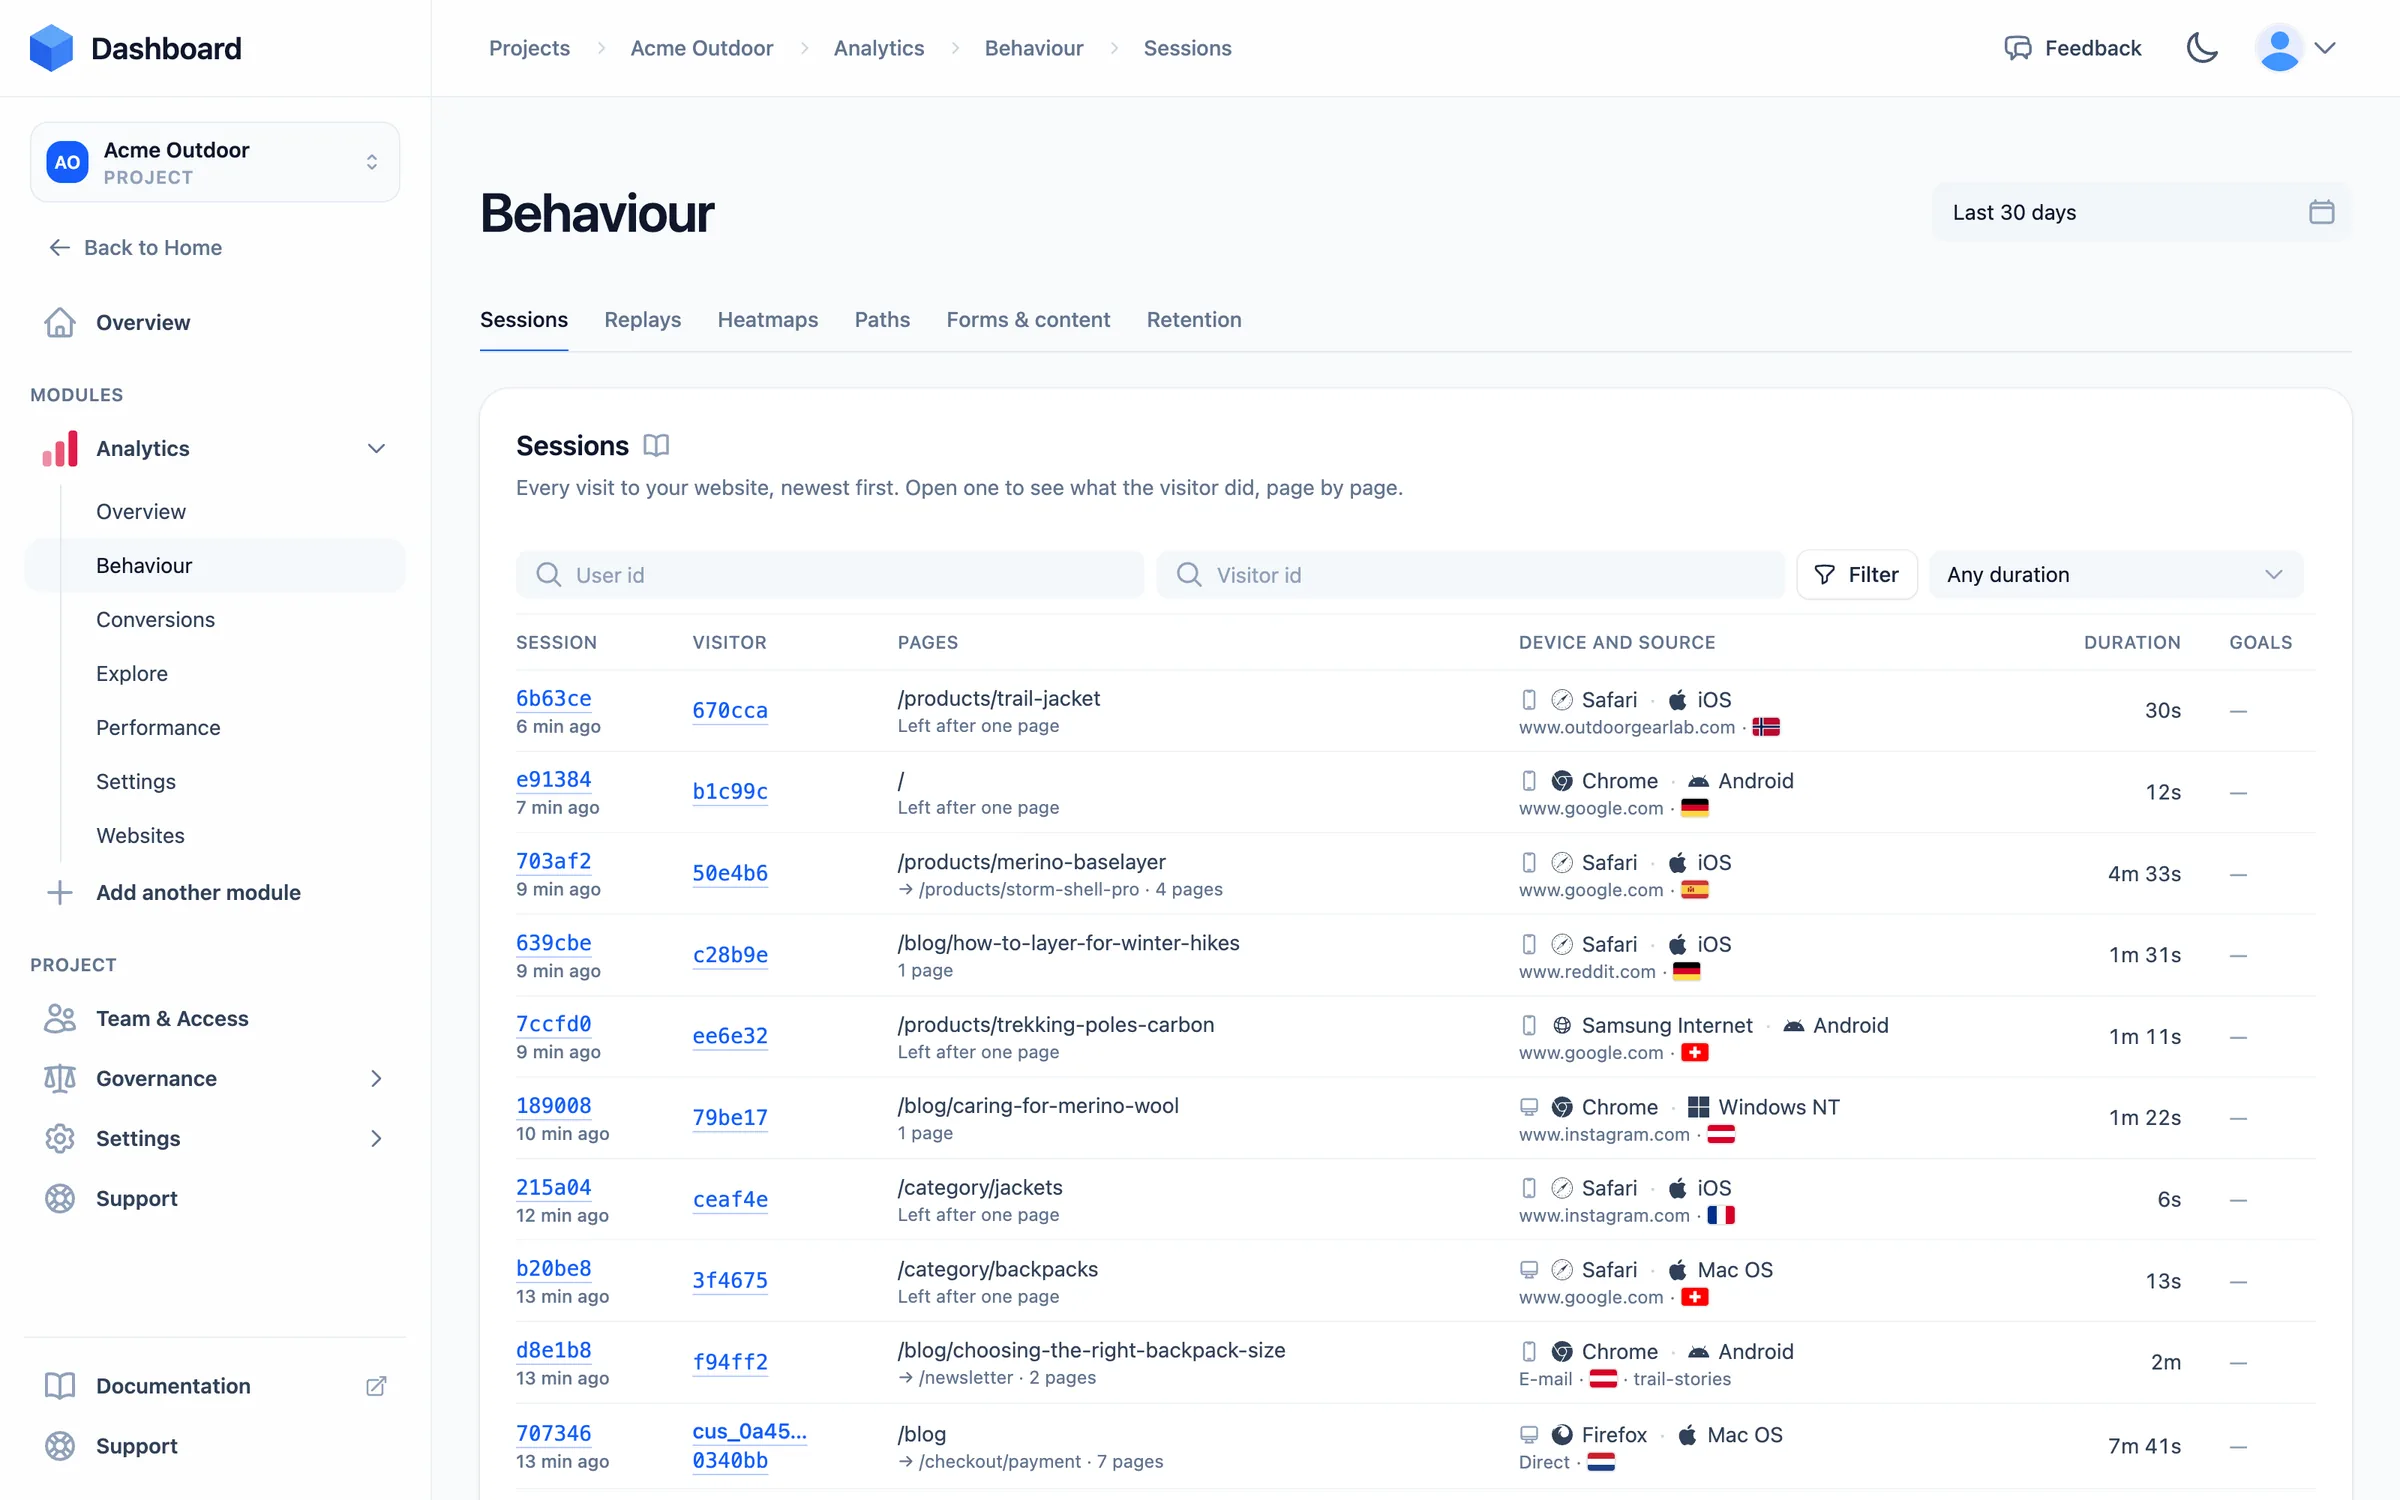
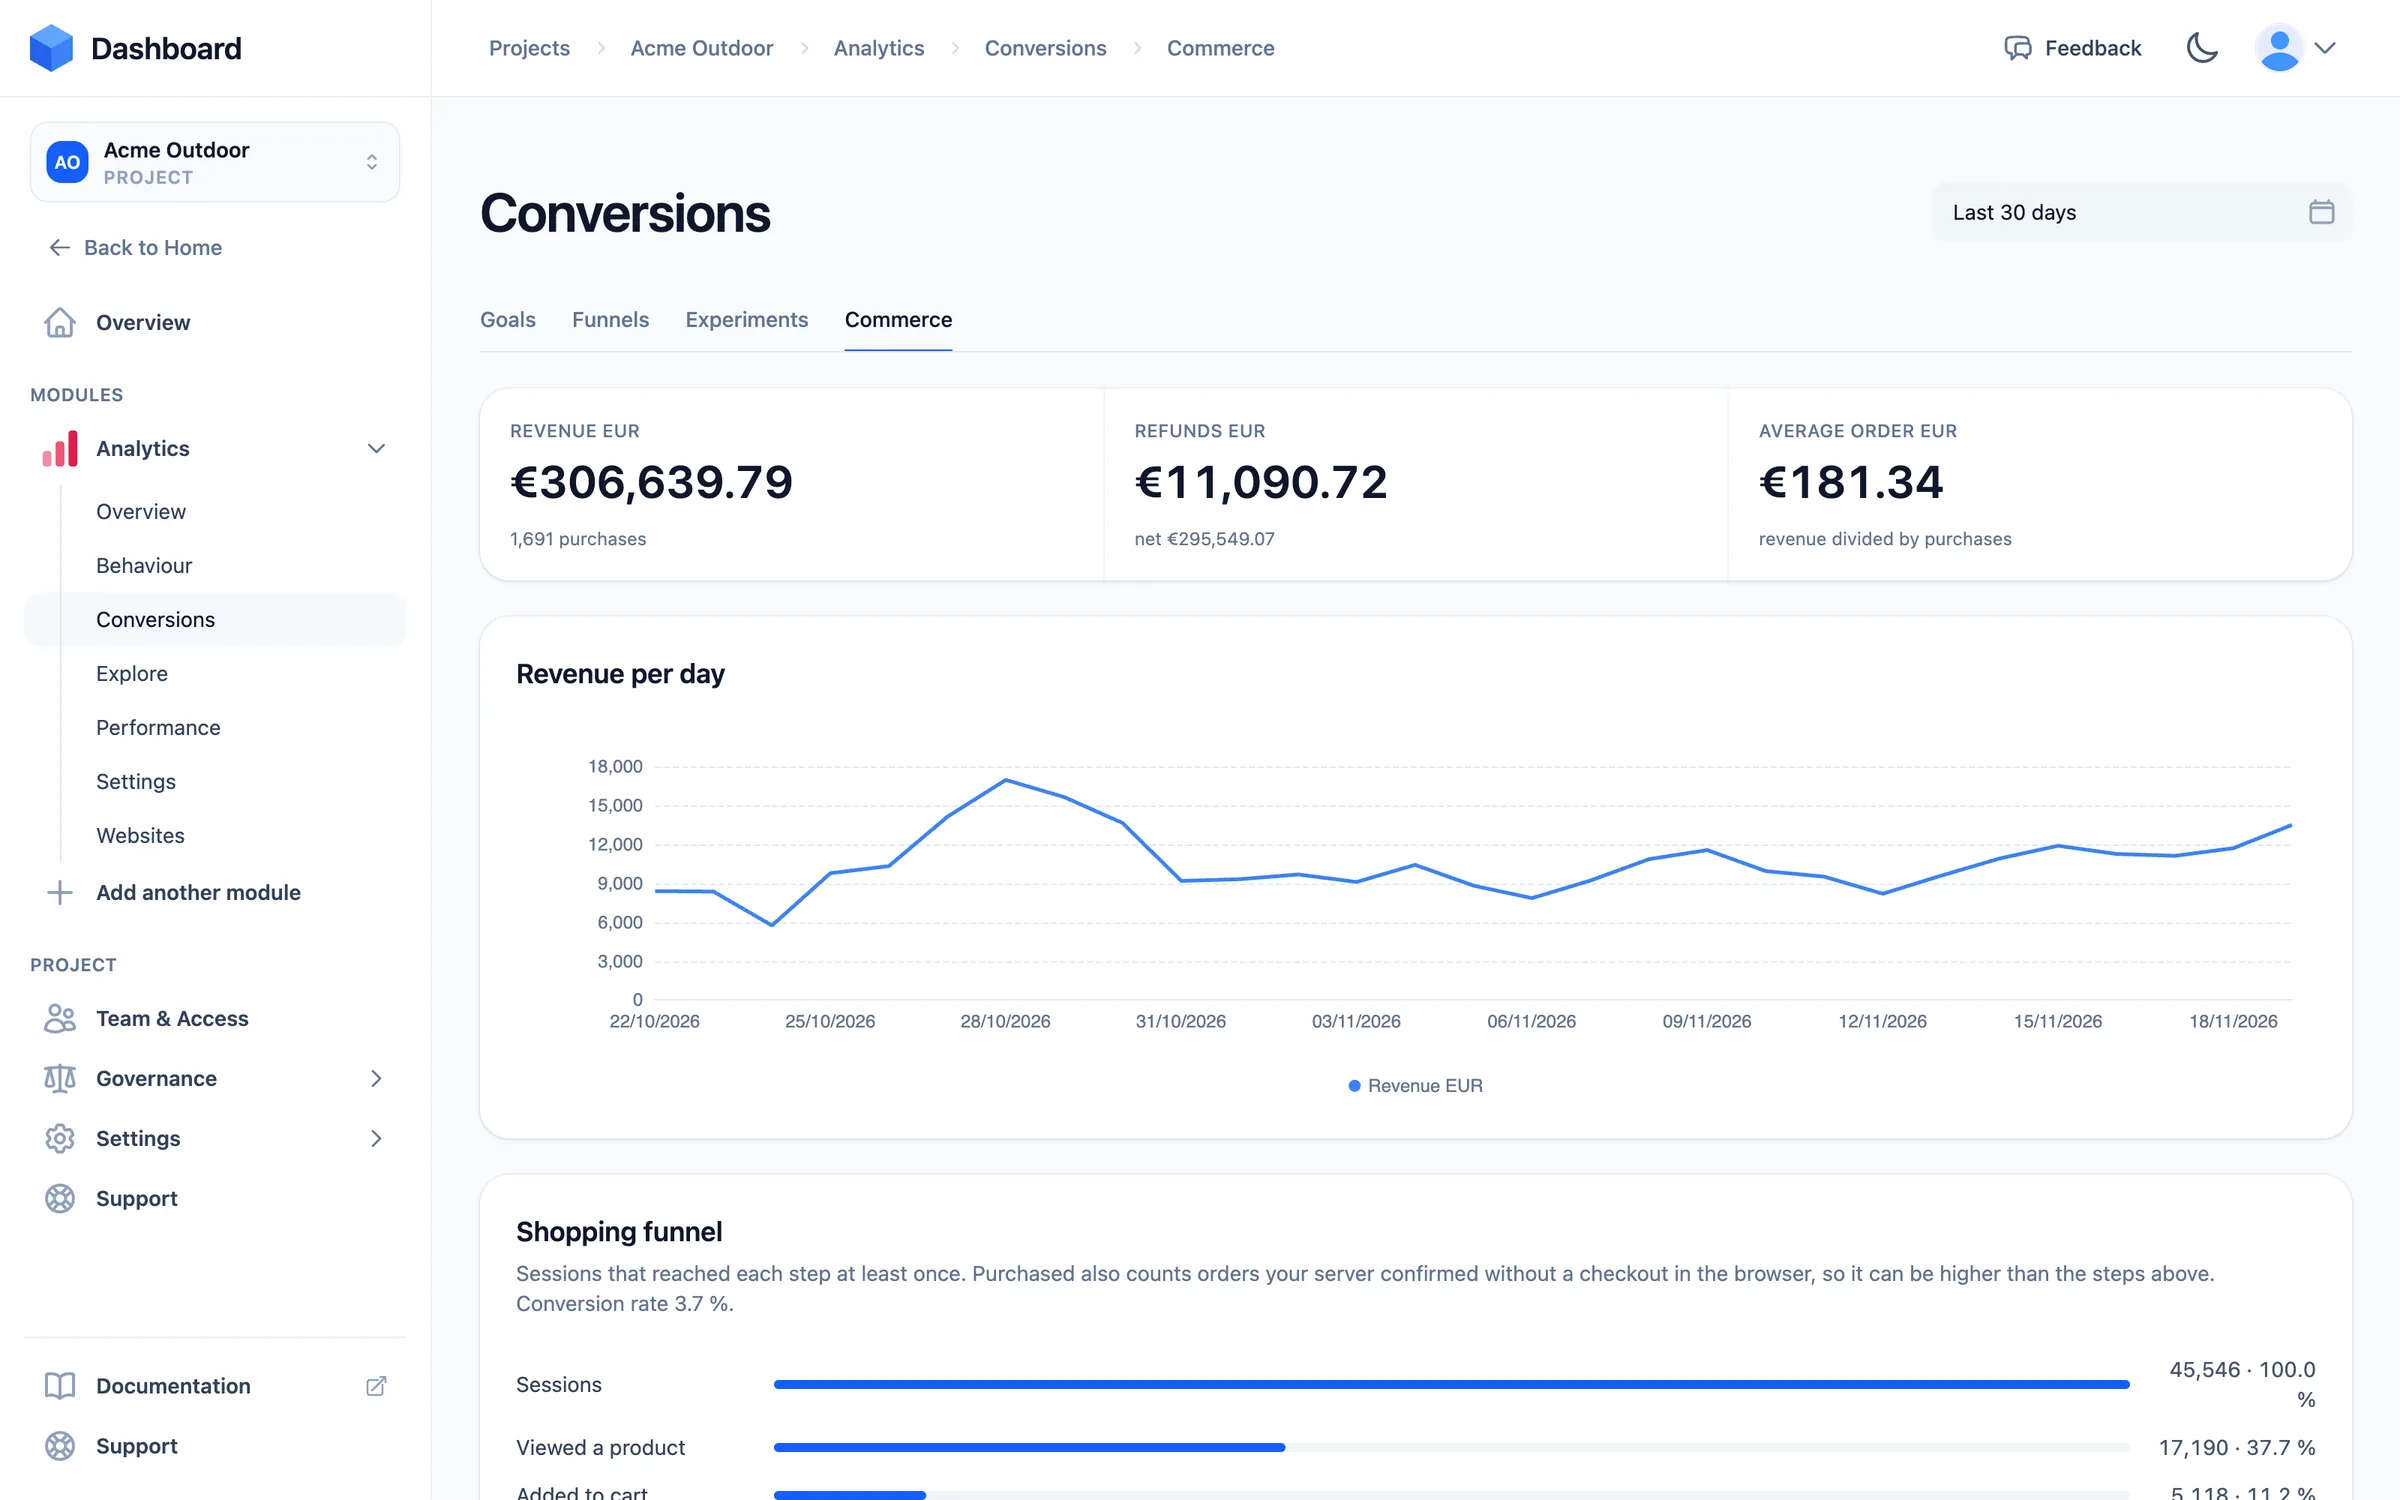
See at a glance whether your traffic grows and where it comes from.
Web analytics
Know where your visitors come from and what they read.
See which channels and pages bring visitors, which ones keep them, and whether this month is better than the last, without building a single report.
- Know which channels work — search, social networks, e-mail, paid ads and AI assistants are told apart, so you put your budget where visitors really come from.
- Watch a launch as it happens — see who is on your site right now when a campaign or a newsletter goes out.
- Answers in one click — click a country, page or campaign and every figure on the screen follows.
- Only real visitors — bots and automated traffic are sorted out for you, so you decide on the behaviour of people and never clean the numbers yourself.
- Keep clients and colleagues in the loop — send a read-only link, with a password if you like. They need no account.
Illustration of where visitors come from: 38% search engines, 24% direct, 14% e-mail, 11% social networks, 6% AI assistants and 7% other websites, with the three strongest campaigns and their conversion rates.
Illustration of a checkout funnel: 21,480 sessions viewed a product, 6,230 added it to the cart, 3,410 started the checkout and 2,290 purchased, with the share of sessions that stopped at each step.
Goals & funnels
See the step where visitors give up.
Say what counts as success for you, an order, a signup or a request, and see at which step visitors drop out, so you fix the one that costs the most first.
- Measure what matters to you — a page, a click, an event or a purchase becomes a goal. It is counted over your past data too, so you do not wait weeks for a result.
- From the number to the people — every step opens the visits that stopped there, so you see what went wrong and stop guessing.
- Understand a single customer — follow a visit page by page, with its source and device, and watch its recording.
- Find the field that costs you leads — see which form field makes people give up, where they go next and how many come back.
- Your own questions, answered — put together your own evaluation, save it and pin it to a dashboard for the team.
Heatmaps & session replay
Watch what a number cannot tell you.
Heatmaps show where visitors click and how far they scroll. Replays play a visit back as it happened, with the moment an error or a rage click occurred marked on the timeline.
Illustration of a click heatmap on a product page, with most clicks on the add to cart button, and of a session replay whose text is masked and whose timeline marks pages, clicks, a rage click and an error.
See what gets attention, and what is ignored
Heatmaps show where visitors click, how far they scroll and where they click in frustration, on desktop, tablet and phone.
Private by default
Texts and inputs are masked in the visitor's browser before anything is sent, so names, messages and passwords never reach us.
Catch the visits that matter
Record a share of all visits or exactly those in which an error happens, and watch the problem happen where you used to try and reproduce it.
Revenue & experiments
Connect your traffic to what it earns.
Visitors are not the goal, revenue is. See which products, sources and campaigns earn money, and which version of a page sells better.
- See where the shop loses orders — from product view to cart, checkout and purchase, with orders and revenue per product.
- Know which campaign pays off — revenue per source and campaign, net of refunds, so you spend on what sells.
- Revenue you can rely on — confirm orders and refunds from your server, so ad blockers and closed tabs do not distort your figures.
- Know when a test has really won — the result per variant tells you whether a difference is real or chance, and warns you when the split is uneven.
Illustration of revenue by source, led by the newsletter with 38,420 euros, and of an experiment in which the green checkout button converts 8.2% better than the control, with a significant result.
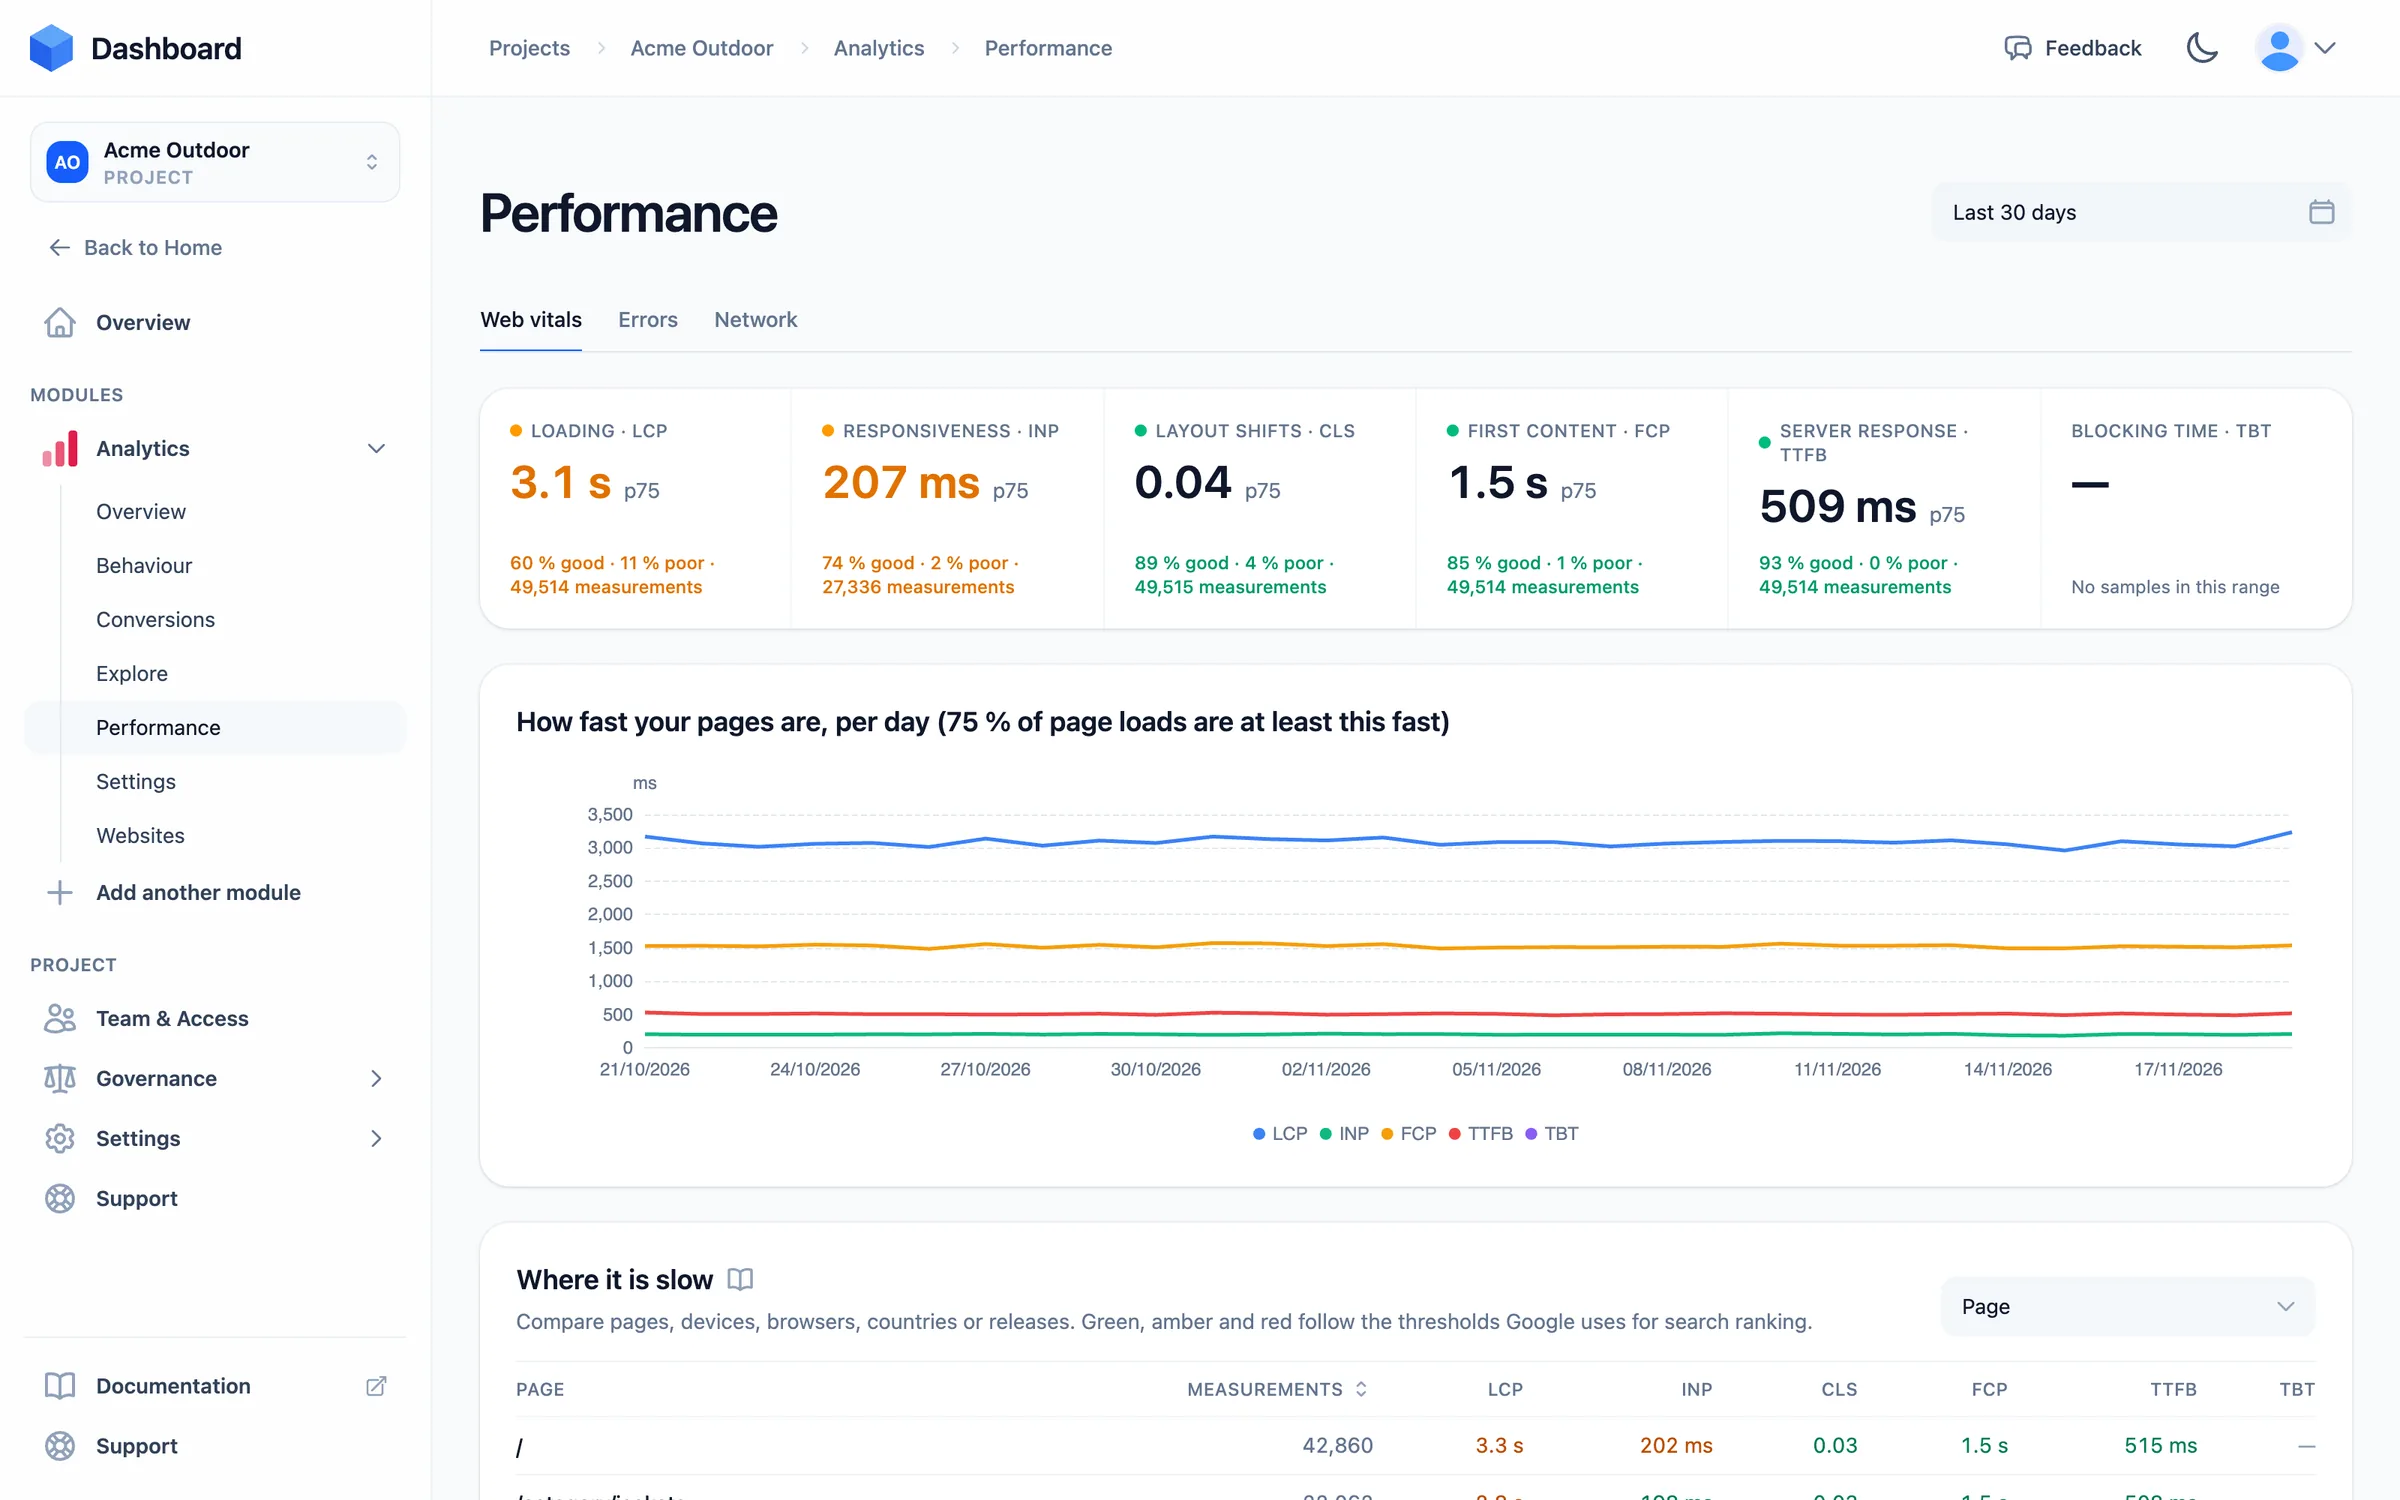
Illustration of Web Vitals at the 75th percentile: LCP 2.1 seconds, good; INP 240 milliseconds, needs improvement; CLS 0.04, good; and three error groups with their occurrences and affected sessions.
Performance & errors
Find the slow page and the broken button.
A slow page or a broken button costs customers long before anyone reports it. You see the problem, how many visitors it hits and what happened on their screen.
- Speed as your visitors feel it — loading time and responsiveness measured in real visits, per page, device and country, so you know which page to speed up first.
- One cause, one entry — a thousand occurrences of the same error are one group that shows the pages and browsers it affects. Mark it resolved when it is fixed.
- Spot what fails in the background — see which requests of your site fail or answer slowly, and on which pages.
- Watch the problem happen — every error opens the visits it happened in, at the moment it happened, so nobody has to reproduce it.
Consent & privacy
You decide what is collected, and when.
Every company and every legal team handles tracking differently. You set what is collected, what waits for consent and what is never collected, and our servers enforce it. Built and hosted in the EU.
- Works without cookies — by default nothing is stored in the visitor's browser: no cookie, no local storage.
- No IP addresses kept — the address is used to derive the country and is then discarded.
- Fine-tuned to your situation — for each kind of data you choose: never, only with consent or always. Your consent banner passes on the visitor's answer, and the setup follows your legal assessment.
- Ready for data requests — find the data of a single visitor, delete it, and decide how long data is kept.
- Paperwork done in minutes — sign the data processing agreement online. Hosted with European providers at European locations.
Illustration of the collection settings of a website: page views are always collected, while custom events, automatic interactions, performance and errors, session replay, and recognition and cookie are collected only with consent.
Find the right report
Which report answers my question?
Start with what you want to know. Every report reads the same events, so the numbers agree from one to the next.
| Your question | Report | What it shows |
|---|---|---|
| Where do my visitors come from? | Overview & attribution | Sources, referrers, UTM campaigns, countries and devices, compared with the period before. |
| Who is on my site right now? | Realtime | The page each active visitor is on at this moment. |
| Which campaign brings buyers? | Goals & commerce | Conversions and revenue per source, campaign and landing page. |
| Where do people leave the checkout? | Funnels | The share of sessions lost at each step, with the sessions behind every number. |
| What do visitors click, and what do they miss? | Heatmaps | Click, rage-click and scroll maps per page, for desktop, tablet and phone. |
| What exactly happened in this visit? | Sessions & replay | Every page and event in order, and a recording with text and inputs masked. |
| Is my site fast for real visitors? | Web vitals | LCP, INP and CLS at the 75th percentile, per page, device and country. |
| Is something broken? | Errors & network | JavaScript errors grouped by cause, and failed or slow requests per endpoint. |
| Which variant of my A/B test wins? | Experiments | Goal conversions per variant with a significance test and the uplift interval. |
Getting started
One script tag, and the first visit shows up.
There is nothing to build or deploy. Add your website, paste the script and open a page. Single-page apps, outbound links, downloads and forms are measured without further code, and the Free plan includes 10,000 page views and events a month.
Illustration of the setup: the script tag with the site key of the website, a call that sends a custom event, and the first page view arriving in the dashboard.
Web analytics FAQ
What is TrustAnalytics?
Does TrustAnalytics use cookies?
Do I need a consent banner?
Which data is stored about a visitor?
How do I install it?
Is there a free plan?
See what visitors do, and what stops them.
- Traffic, funnels, heatmaps & replay
- No cookies by default, EU-hosted
- One script tag