
'%3e%3crect%20width='32'%20height='24'%20fill='white'/%3e%3cpath%20fill-rule='evenodd'%20clip-rule='evenodd'%20d='M0%200V24H32V0H0Z'%20fill='%232E42A5'/%3e%3cmask%20id='mask0_270_67386'%20style='mask-type:luminance'%20maskUnits='userSpaceOnUse'%20x='0'%20y='0'%20width='32'%20height='24'%3e%3cpath%20fill-rule='evenodd'%20clip-rule='evenodd'%20d='M0%200V24H32V0H0Z'%20fill='white'/%3e%3c/mask%3e%3cg%20mask='url(%23mask0_270_67386)'%3e%3cpath%20d='M-3.56323%2022.2854L3.47846%2025.2635L32.1597%203.23787L35.874%20-1.18761L28.344%20-2.18297L16.6456%207.3085L7.22956%2013.7035L-3.56323%2022.2854Z'%20fill='white'/%3e%3cpath%20d='M-2.59924%2024.3719L0.988173%2026.1001L34.5402%20-1.59881H29.5031L-2.59924%2024.3719Z'%20fill='%23F50100'/%3e%3cpath%20d='M35.5631%2022.2854L28.5214%2025.2635L-0.159817%203.23787L-3.87415%20-1.18761L3.65593%20-2.18297L15.3543%207.3085L24.7703%2013.7035L35.5631%2022.2854Z'%20fill='white'/%3e%3cpath%20d='M35.3229%2023.7829L31.7355%2025.5111L17.4487%2013.6518L13.2129%2012.3267L-4.23151%20-1.17246H0.805637L18.2403%2012.0063L22.8713%2013.5952L35.3229%2023.7829Z'%20fill='%23F50100'/%3e%3cmask%20id='path-7-inside-1_270_67386'%20fill='white'%3e%3cpath%20fill-rule='evenodd'%20clip-rule='evenodd'%20d='M19.7777%20-2H12.2222V8H-1.97253V16H12.2222V26H19.7777V16H34.0275V8H19.7777V-2Z'/%3e%3c/mask%3e%3cpath%20fill-rule='evenodd'%20clip-rule='evenodd'%20d='M19.7777%20-2H12.2222V8H-1.97253V16H12.2222V26H19.7777V16H34.0275V8H19.7777V-2Z'%20fill='%23F50100'/%3e%3cpath%20d='M12.2222%20-2V-4H10.2222V-2H12.2222ZM19.7777%20-2H21.7777V-4H19.7777V-2ZM12.2222%208V10H14.2222V8H12.2222ZM-1.97253%208V6H-3.97253V8H-1.97253ZM-1.97253%2016H-3.97253V18H-1.97253V16ZM12.2222%2016H14.2222V14H12.2222V16ZM12.2222%2026H10.2222V28H12.2222V26ZM19.7777%2026V28H21.7777V26H19.7777ZM19.7777%2016V14H17.7777V16H19.7777ZM34.0275%2016V18H36.0275V16H34.0275ZM34.0275%208H36.0275V6H34.0275V8ZM19.7777%208H17.7777V10H19.7777V8ZM12.2222%200H19.7777V-4H12.2222V0ZM14.2222%208V-2H10.2222V8H14.2222ZM-1.97253%2010H12.2222V6H-1.97253V10ZM0.0274658%2016V8H-3.97253V16H0.0274658ZM12.2222%2014H-1.97253V18H12.2222V14ZM14.2222%2026V16H10.2222V26H14.2222ZM19.7777%2024H12.2222V28H19.7777V24ZM17.7777%2016V26H21.7777V16H17.7777ZM34.0275%2014H19.7777V18H34.0275V14ZM32.0275%208V16H36.0275V8H32.0275ZM19.7777%2010H34.0275V6H19.7777V10ZM17.7777%20-2V8H21.7777V-2H17.7777Z'%20fill='white'%20mask='url(%23path-7-inside-1_270_67386)'/%3e%3c/g%3e%3c/g%3e%3cdefs%3e%3cclipPath%20id='clip0_270_67386'%3e%3crect%20width='32'%20height='24'%20fill='white'/%3e%3c/clipPath%3e%3c/defs%3e%3c/svg%3e)
'%3e%3crect%20width='32'%20height='24'%20fill='white'/%3e%3cpath%20fill-rule='evenodd'%20clip-rule='evenodd'%20d='M0%2016H32V24H0V16Z'%20fill='%23FFD018'/%3e%3cpath%20fill-rule='evenodd'%20clip-rule='evenodd'%20d='M0%208H32V16H0V8Z'%20fill='%23E31D1C'/%3e%3cpath%20fill-rule='evenodd'%20clip-rule='evenodd'%20d='M0%200H32V8H0V0Z'%20fill='%23272727'/%3e%3c/g%3e%3cdefs%3e%3cclipPath%20id='clip0_270_67353'%3e%3crect%20width='32'%20height='24'%20fill='white'/%3e%3c/clipPath%3e%3c/defs%3e%3c/svg%3e)
'%3e%3crect%20width='32'%20height='24'%20fill='white'/%3e%3cpath%20fill-rule='evenodd'%20clip-rule='evenodd'%20d='M22%200H32V24H22V0Z'%20fill='%23F50100'/%3e%3cpath%20fill-rule='evenodd'%20clip-rule='evenodd'%20d='M0%200H12V24H0V0Z'%20fill='%232E42A5'/%3e%3cpath%20fill-rule='evenodd'%20clip-rule='evenodd'%20d='M10%200H22V24H10V0Z'%20fill='%23F7FCFF'/%3e%3c/g%3e%3cdefs%3e%3cclipPath%20id='clip0_270_67361'%3e%3crect%20width='32'%20height='24'%20fill='white'/%3e%3c/clipPath%3e%3c/defs%3e%3c/svg%3e)
Introduction: checking uptime on Windows Server
How long has this server been running? It is one of the first questions after a patch day, an unplanned restart or a performance investigation. Windows Server answers it in several ways, from a quick look in Task Manager to a one-line PowerShell command you can run against a whole list of servers.
This guide shows four ways to check uptime on Windows Server, explains how to read the results, and covers the one thing OS uptime cannot tell you: whether your users can actually reach the services running on that server.
Method 1: Task Manager
The quickest windows server uptime check needs no command line:
- Press Ctrl + Shift + Esc to open Task Manager.
- Open the Performance tab and select CPU.
- Read the value next to Up time, shown as days, hours, minutes and seconds.
Method 2: PowerShell
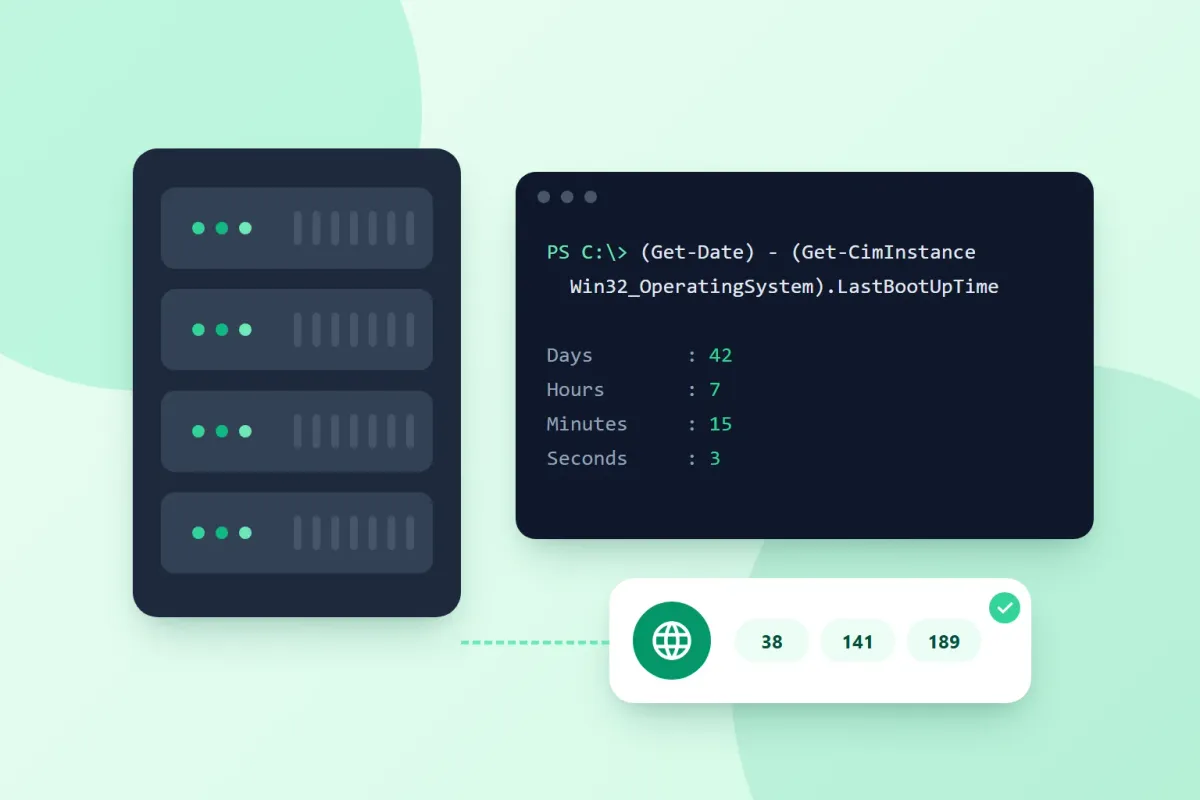
PowerShell gives you the exact uptime and works well in scripts. Calculate the time since the last boot:
(Get-Date) - (Get-CimInstance -ClassName Win32_OperatingSystem).LastBootUpTimeThe result is a time span with days, hours, minutes and seconds. If you only need the boot time itself:
(Get-CimInstance -ClassName Win32_OperatingSystem).LastBootUpTimeIn PowerShell 7, the built-in Get-Uptime cmdlet returns the same information, and Get-Uptime -Since returns the boot time.
Check server uptime on remote machines
To check server uptime for several servers at once, query them remotely. The servers must accept CIM connections (WinRM) from your machine:
Get-CimInstance -ComputerName SRV01, SRV02 -ClassName Win32_OperatingSystem |
    Select-Object PSComputerName, LastBootUpTime
Method 3: systeminfo in the Command Prompt
The classic command-line tool shows the boot time together with other system details:
systeminfo | find "System Boot Time"On a localized Windows installation, the label is translated (for example Systemstartzeit on a German system), so adjust the search text. Alternatively, net statistics workstation shows a “Statistics since” line, which reflects the time the workstation service started at boot.
Method 4: Event Viewer
Event Viewer shows not only when the server started, but also how it stopped. Open Event Viewer → Windows Logs → System and filter for these Event IDs:
| Event ID | Meaning |
|---|---|
| 6005 | The event log service started, logged at every boot |
| 6006 | The event log service stopped, which marks a clean shutdown |
| 6008 | The previous shutdown was unexpected |
| 6013 | The system uptime in seconds, usually logged once a day |
The same events are available in PowerShell, which makes it easy to review the last restarts:
Get-WinEvent -FilterHashtable @{ LogName = 'System'; Id = 6005, 6006, 6008 } -MaxEvents 10 |
    Select-Object TimeCreated, Id, Message
A note on Windows 10 and 11: Fast Startup
If you check uptime on a Windows client and the value is surprisingly high, Fast Startup is the likely reason: it hibernates the kernel instead of shutting it down completely, so the uptime counter continues after a shutdown. A restart always resets it.
Server uptime vs availability
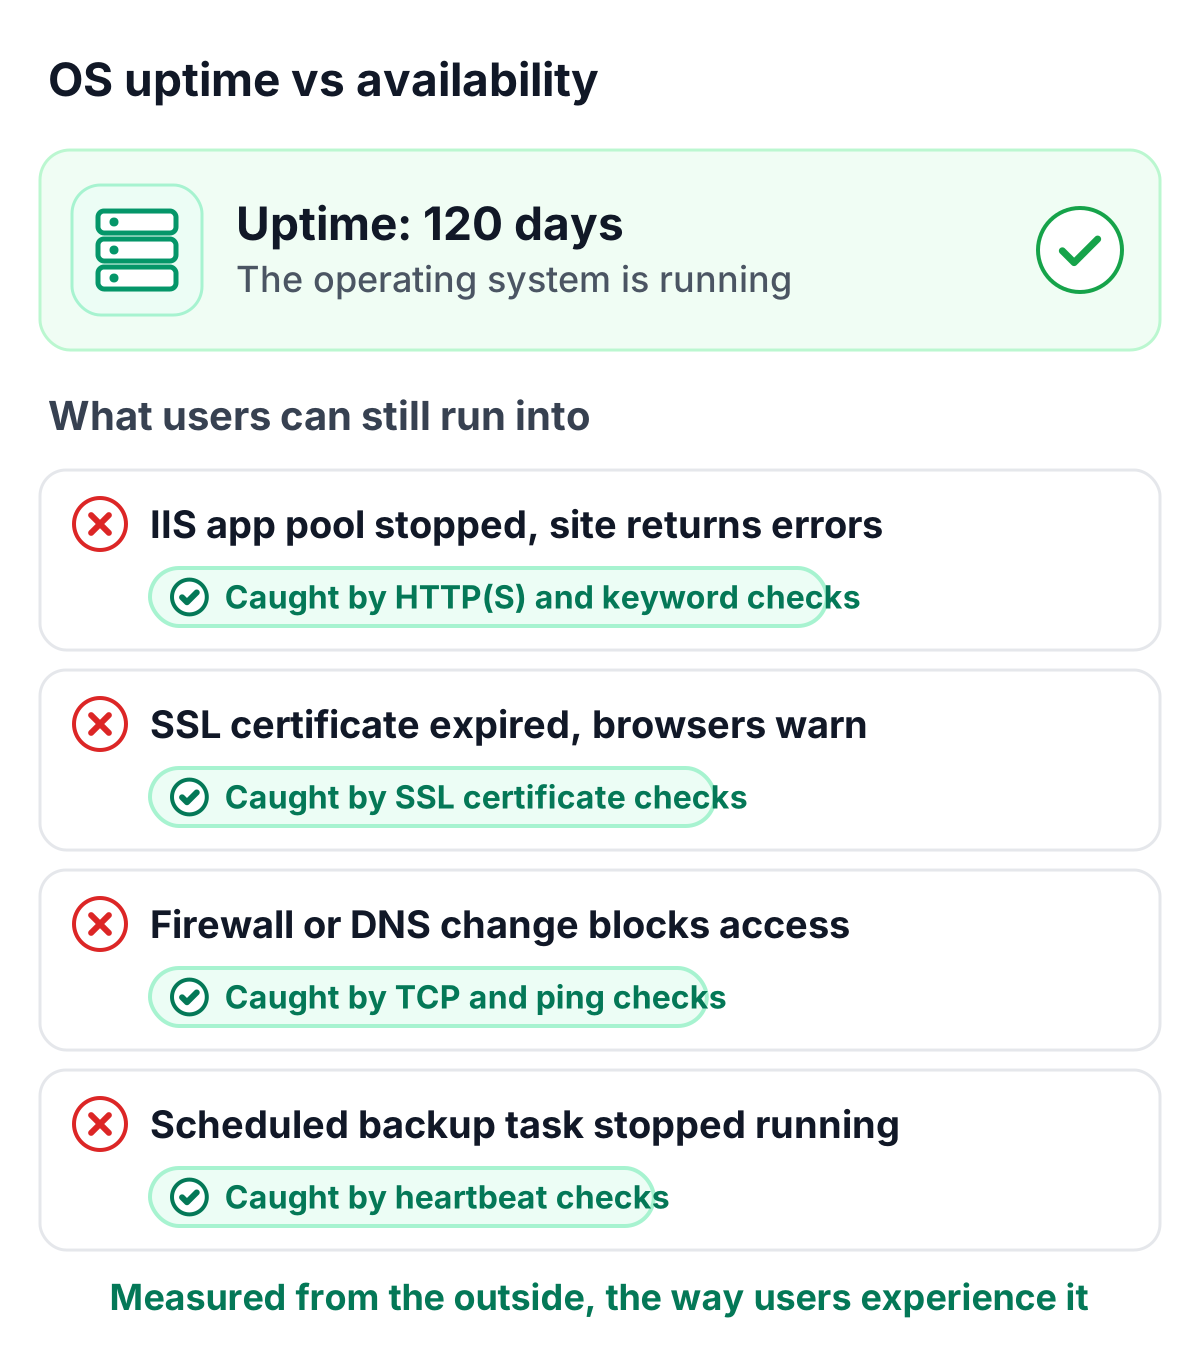
Uptime on Windows Server tells you how long the operating system has been running. It does not tell you whether your users can work. A server can show 120 days of uptime while:
- an IIS application pool has stopped and the website returns errors,
- an SSL certificate has expired and browsers show a warning,
- a firewall rule or DNS change makes a service unreachable from outside,
- a scheduled backup task has quietly stopped running.
Each of these is easy to fix once you know about it. The key is to measure availability the way your users experience it: from the outside.
Monitor Windows Server availability from the outside
External monitoring complements OS uptime with the view that matters to your users:
- HTTP(S) and keyword checks confirm that websites and web applications respond with the expected content.
- TCP and ping checks confirm that the ports and services you expose are reachable.
- SSL certificate checks report upcoming expiry dates well in advance.
- Heartbeat checks confirm that scheduled tasks actually ran.
Add a heartbeat to a Task Scheduler job
Scheduled tasks run quietly in the background. With a heartbeat, a task reports in after every successful run, and a missing check-in becomes an alert. Add one line to the end of your script, using the heartbeat URL from your monitor:
& C:\Scripts\backup.ps1
if ($LASTEXITCODE -eq 0) {
    Invoke-RestMethod -Uri "https://your-heartbeat-url"
}
How TrustComponent Monitoring helps
TrustComponent Monitoring provides server uptime monitoring from the outside, with no agent to install on your Windows servers:
- 16 check types, including HTTP(S), keyword, ping, TCP, SSL certificate and heartbeat checks
- Checks as often as every 30 seconds, from multiple locations
- Alerts by email, SMS, voice call, Slack, Teams and more, with escalation chains until someone takes ownership
- Uptime reports and a status page that show your availability to customers and colleagues
Conclusion
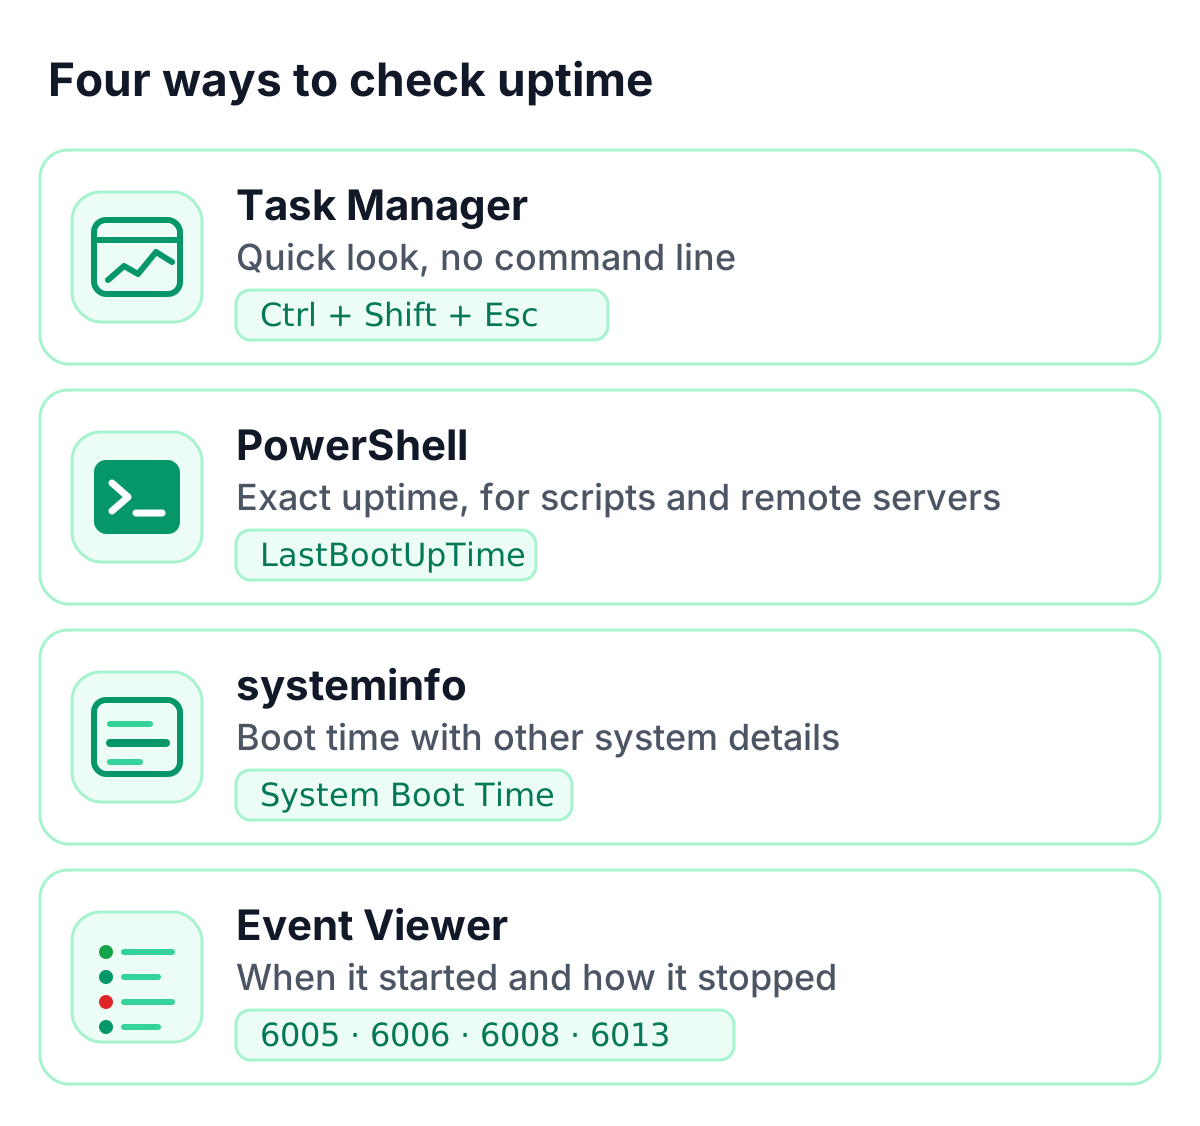
Checking uptime on Windows Server takes seconds: Task Manager for a quick look, PowerShell for scripts and remote servers, Event Viewer for the history of starts and shutdowns. Combine it with external monitoring, and you know both how long your servers have been running and whether your services are available.
Get started
👉 Start a free trial of TrustComponent Monitoring and add your first server checks in minutes.